Data visualization is being used as an important tool for decision-making process by businesses. Learn more on how it helps in getting business insights.
How do you come to a conclusion while taking any business critical decision? Do you solely depends on the board of advisory or take into account the statistics and past data to base your decision?
Though board of advisory is experienced enough to make the correct decisions collectively, it is always wise to take help of latest technology that compiles data and assists in making an informed decision.
What is Data Visualization?
The concept of data visualization emerged from the failure to understand the usability of information when represented in text-based form. Then the idea of displaying large amount of data in visually appealing and understandable format, which is called as data visualization, came into picture.
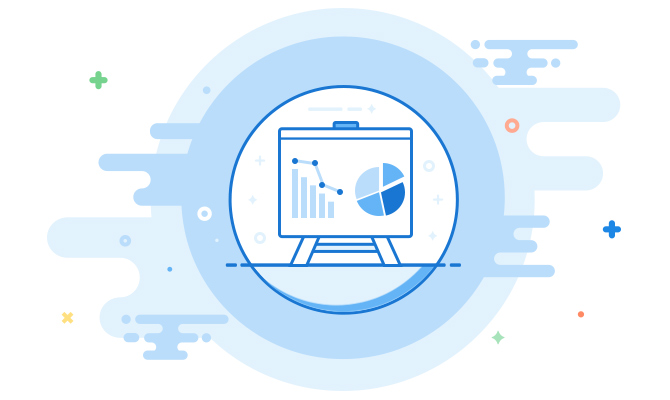
What is the Primary Purpose of Data Visualization?
To explain in simple words, data visualization can be termed as decision makers or support system for experts to come to a conclusion. Use of appropriate techniques to represent the data in well-structured manner can work wonders when in a fix.
Visually presented data puts lights on aspects, which were left unnoticed earlier. These insights educated the businessmen and experts on common pattern and trends in their businesses. This gives a new angle to the entire decision-making process.
Data visualization brings forth all possible relationship and interconnections in data to analyze trends, which are otherwise not possible to scrutinize in text-based data format.
Read This: Why Startups Should Invest in Mobile Application Development?
Who are Benefitted by Data Visualization and How?
Mobile app development agencies, web development agencies or any other companies in Information Technology domain are strongly influenced by data visualization. It becomes mandatory for these companies to analyze user behavior and navigation pattern.
This problem is solved with data visualization concept coming to rescue, which effectively displays business critical data in easy to understand visual format.
The need for data visualization persists for every IT firm, be it small or medium size company or a big enterprise. Monitoring of large volume of data seems to be a nightmare without this concept. Some worth highlighting benefits of data visualization are as follows:
- Companies with ‘n’ number of social presence on different medium need a compilation to analyze the strong area from where leads are generated. Data visualization plays an important role there.
- Consumer complaints can be compiled at one place to act upon it seriously.
- Google analytics data, which is most important for online sales, is put together for proper analysis to derive useful insights.
- Data visualization enables automatic mapping of interconnected data, thereby highlighting relationships that come to light instantly.
- Creating reports of significant information is a cheesecake under the assistance of data visualization.ConclusionOne wrong decision and you are about to experience a steep downfall in your business career. Though ups and downs are a part of businessmen lives, staying wise and updated with latest technologies is beneficial for them.Data visualization is being increasingly adopted by companies for making business strategies followed by revised business operations, all of which is based on data derived from this powerful concept.


No comments:
Post a Comment